News
FTIR ANALYSIS

FTIR ANALYSIS
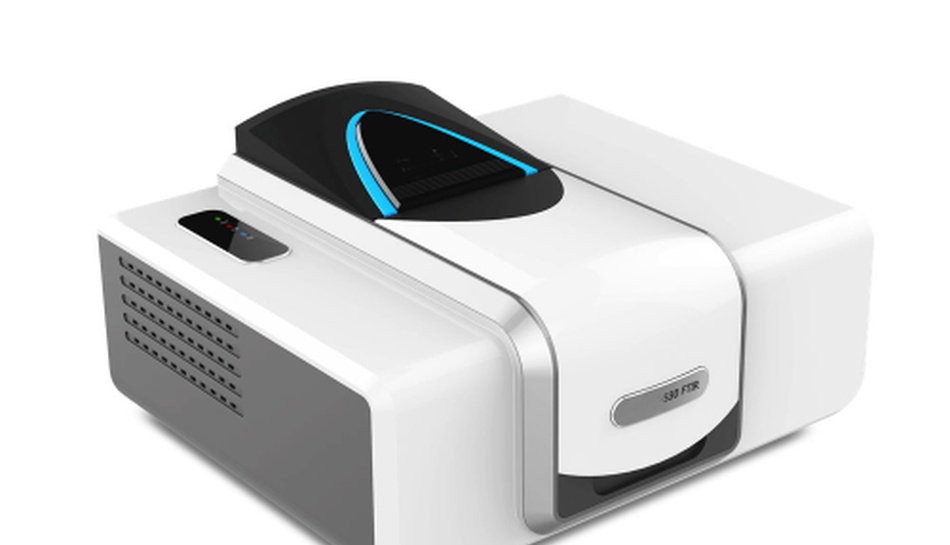
This is one of the testing facilities,we conducted for our clients who wanted to know more of their polymer composites.
Methodology: FTIR analysis was carried out using ATR method between the wavelength of 400 cm-1 and 4000 cm-1. The samples were scanned 32 times. The spectrum obtained was analyzed to find possible composition. The client suspects the samples to contain either ethylene vinyl acetate (EVA) or to be thermoplastic olefin. The samples were labeled as X-CF, X-DP and control Sample (total 3 samples)
Analysis: All the samples showed similar functional groups. The functional groups are being listed as in Table 1. There is slight variation between the ratio of intensity of peak at 873 and 1091cm-1 where one peak intensity increases another peak intensity reduces.
Table 1
The samples were not classified as EVA because EVA should exhibit a very strong peak 1650-1700 cm-1 and another peak at 1234 cm-1. The samples also did not exhibit the common double peak at wavelength range of 1500 to 1300 cm-1 which is finger print peaks for ethylene propylene copolymer.
Conclusion: Propose further meeting with product owner for explanation of results and information gathering.