News
using XRD analysis to have a better understanding of pigment characteristics.

using XRD analysis to have a better understanding of pigment characteristics.
EDX analysis
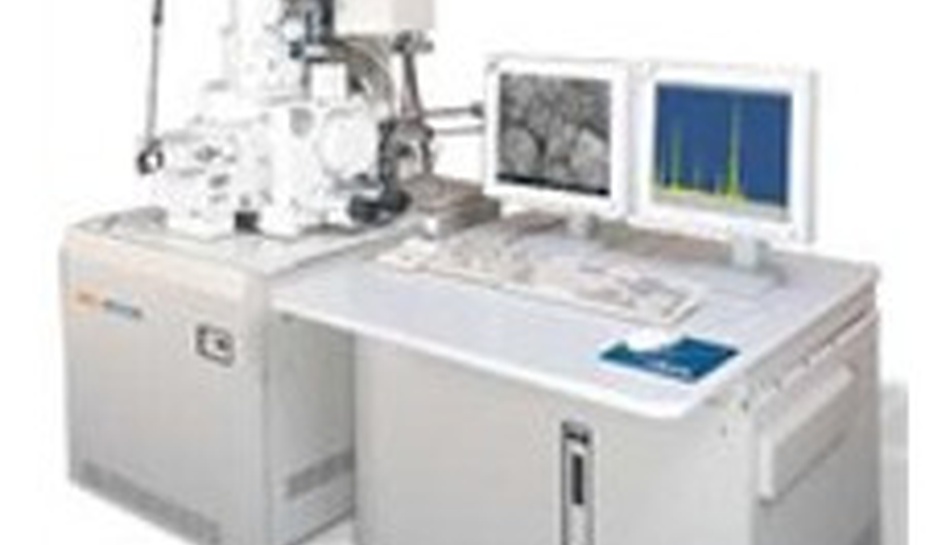
EDX analysis was carried out on sample A4, A5, B1 and B2 using field emission scanning electron microscope (FESEM), model JSM 6701F from JEOL, Japan. EDX analysis for sample A4 and A5 will only scan the surface of the sample.
XRD analysis was carried out at 2θ angle of 0-90 ̊ with step scan of 1 ̊/min for sample B1, B2 and B3.
EDX analysis for sample B1 and B2 are presented in Table 2. This analysis was carried out on TiO2powders.
Table 2: EDX analysis for TiO2 powders
|
Elements (%) |
B1 |
B2 |
|
O |
55.89 |
46.87 |
|
Al |
0.79 |
0.742 |
|
Ti |
42.41 |
50.79 |
|
Cu |
0.89 |
1.0723 |
|
Zn |
- |
0.97 |
EDX analysis for roof claddings are presented in Table 3
Table 3: EDX analysis for roof claddings
|
Elements (%) |
A4 |
A5 |
|
C |
66.11 |
65.10 |
|
O |
29.17 |
30.86 |
|
Al |
3.25 |
1.92 |
|
Cl |
1.47 |
2.12 |
Analysis of results
EDX analysis from Table 1 shows that sample B1 contains less titanium than sample B2. Moreover sample B2 shows traces of Zn. Both sample B1 and B2 are being coated with aluminum oxide.
The main difference between EDX results of sample A4 and A5 is the Al content. Sample A5 contains less Al compared to sample A4. Al is contributed by the coatings on the surface of TiO2. Thus this might lead to a conclusion where the content on TiO2 in sample A5 is lesser than sample A4. Lead were not detected on the on the surface of roof claddings.
Conclusion
TiO2 is reduced from Ti4+ to Ti3+ upon exposure to UV. Ti3+ photochemical reaction with lead stabilizer could cause reduction of lead from Pb2+ to metallic Pb0 upon exposure to UV. But upon contact with oxygen Pb0 will be oxidized again to Pb2+. Thus in the weathering test visual inspection does not show any changes on the sample colors. Moreover the reduction of TiO2 upon exposure to UV followed by reaction of TiO2 with lead is also dependent on the structure of TiO2 and the efficiency of coating. The rutile structure absorbs smaller range of UV wavelength and good coating can avoid TiO2 exposure to UV. The sample B3 shows rutile structure with no anatase trace from XRD analysis.
The TiO2 samples shows inconsistency in term of rutile and anatase phase and also some batches has less than 96% TiO2. However to confirm this more samples have to be send for XRD test in the same batch.
If readers are interested to conduct XRD analysis,please write to [email protected]